Astronomical spectroscopy is the method of spreading light from a star in to the the rainbow of colors (a spectrum) of which the light is build up. Every element has its own specific spectral lines by which those elements can be recognized.
This is caused by the way an atom is build up. For example below is a Hydrogen atom. If a hydrogen atom is heated up, the electron can jump up to a higher orbital. To do that, it needs to absorb energy, in the form of a photon of light. To lose energy, it can jump back down to a lower orbital, by emitting a photon. An electron can only jump to very specific orbitals, and the height of those orbitals is different for every element. This is the way an element can be identified by spectroscopy, as it absorbs and emits only specific wavelenghts of light.
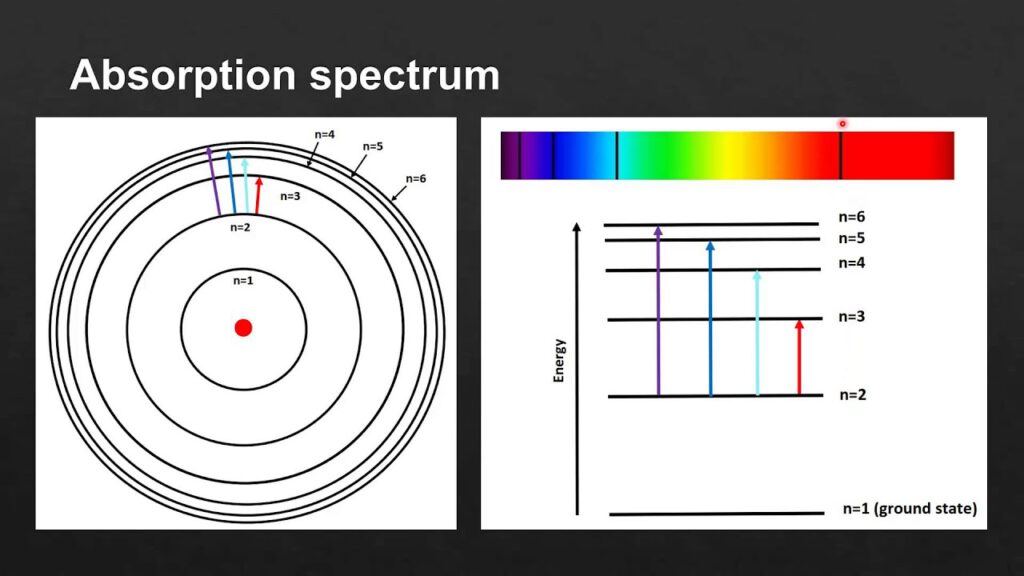
An element can be heated and start to glow, causing emission at the specific colors for that element (emission spectrum). An element inside a the outer envelope of a star can also absorb light at the specific wavelength of that element. In that case part of the light from the star is absorbed at those specific colors (absorption spectrum).
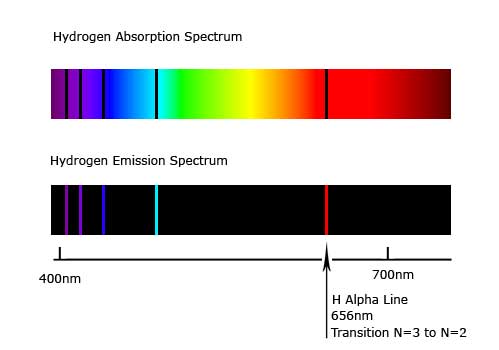
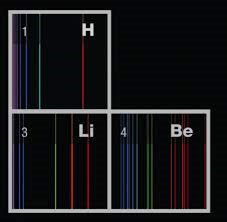
Every element is build up of electron orbitals in its own specific way. That is why every element has its own spectral fingerprint with which it can be recognized in a spectrum.
Star analyzer diffraction grating
The light of the star which I do spectroscopy on passes through a diffraction grating. In my case the star analyzer with 100 lines per milimeter. In my case this results in spectroscopy with a resolution of R ~ 100. This is specifically suitable for faint targets such as novea and supernovae.
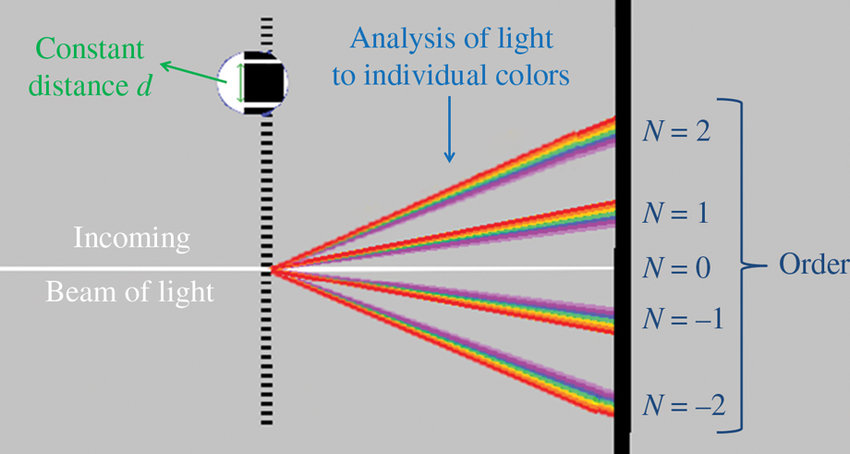
The diffraction grating splits the starlight into an number of rainbows. One of those (the first order (N=1)), falls on the sensor and is used for spectroscopy.
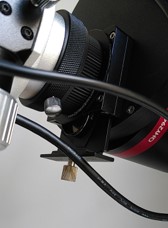
I have put a filter slider in front of my filterwheel, where I can put in the star analyzer. That way I can easily swap from normal imaging to spectroscopy.
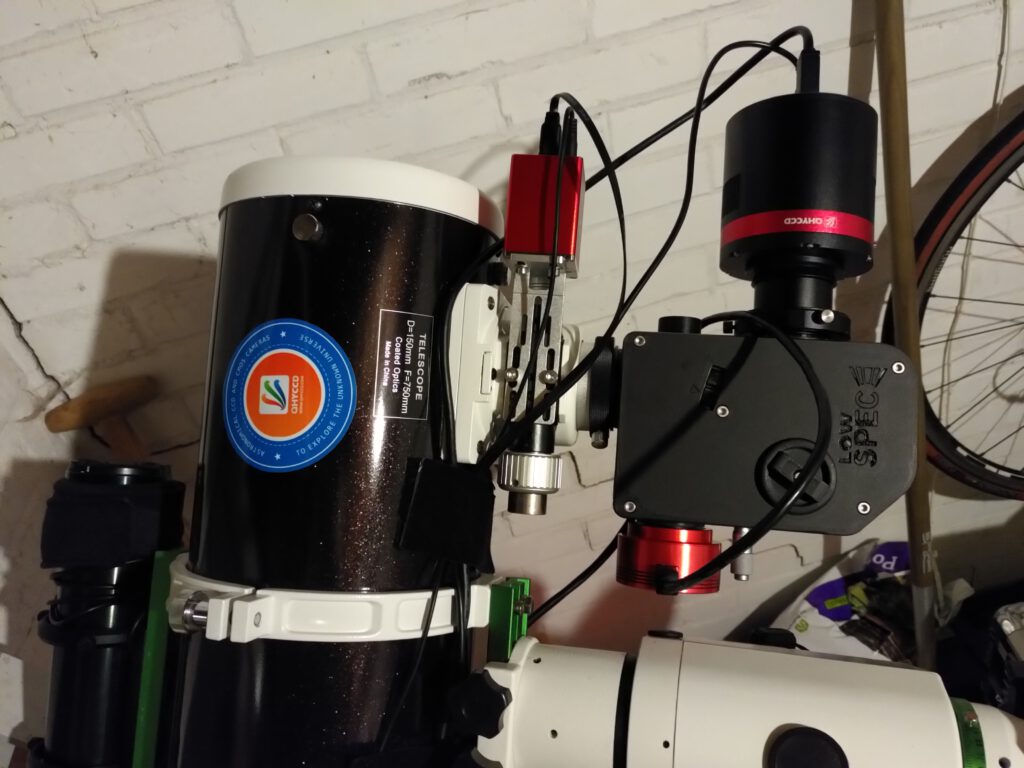
Lowspec 3D printed slit spectroscope
I have built my own slit spectroscope for higher resolution spectroscopy. This results in spectroscopy with a resolution of R = 500 to 1.000 for the 300 lines/mm grating. This is suitable for brighter targets but also for bright extended targets such as bright nebulae.
I described the building process of the Lowspec here
Rspec astro software
For the analysis of my raw data I use the software program Rspec-astro. With that I can convert the raw spectrum of a star in my picture into the spectra you can find below.
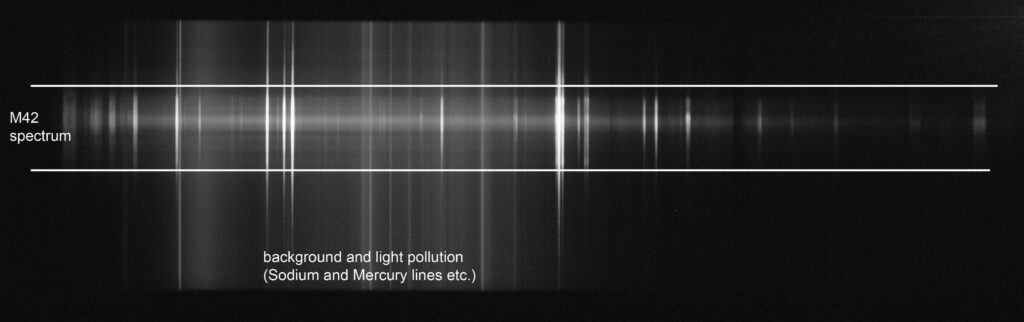
A raw spectrum on my camera sensor look likes the image below. At the left there is the star, and to the right of it is the spectrum with the light of that star spread out by the star analyzer diffraction grating. The bright and dim spots in that spectrum will translate into peaks and dips in the spectrum after the analysis is done.
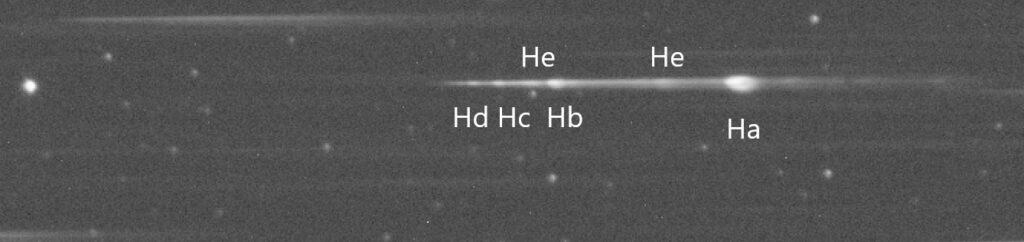
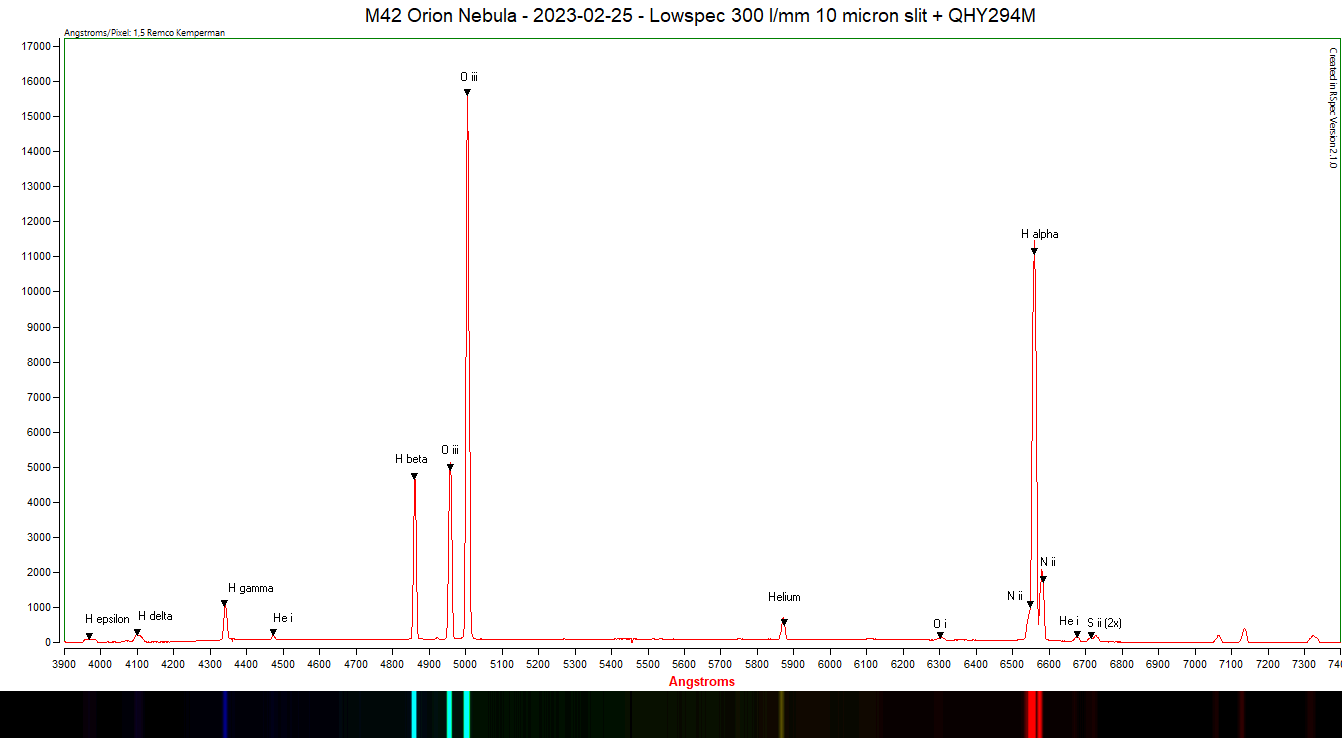
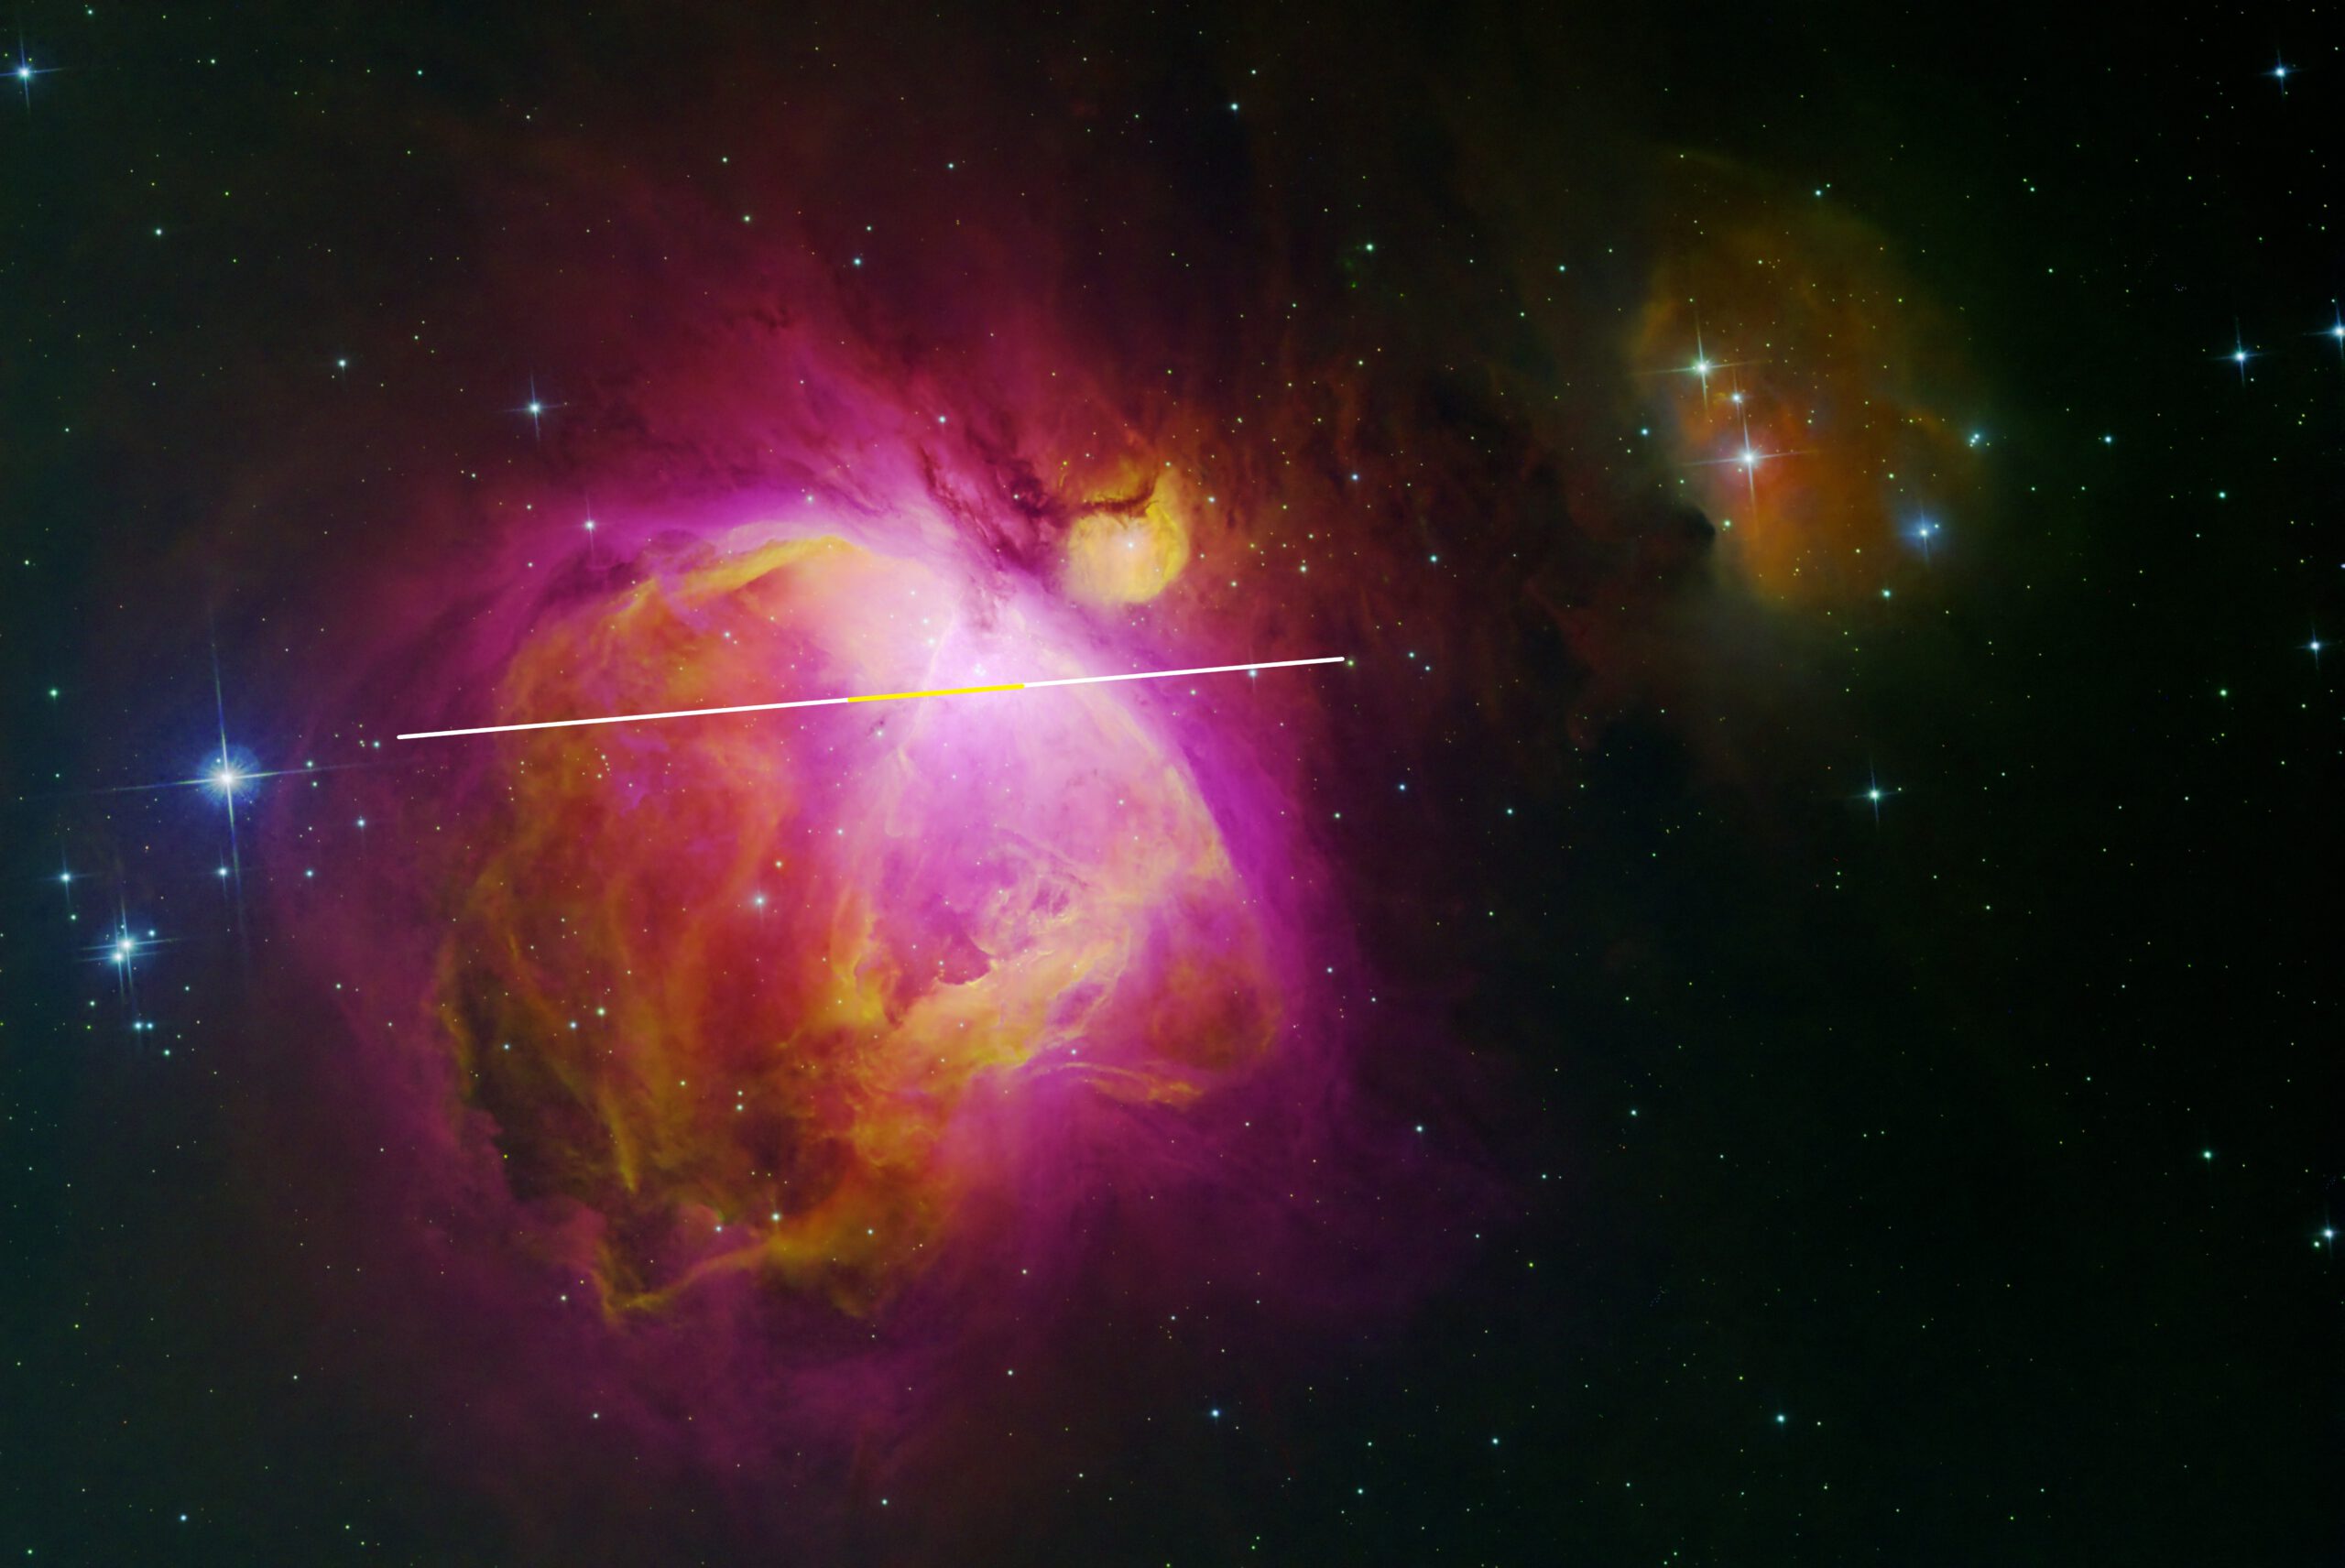
Orion nebula with the Lowspec spectroscope
One of the first projects with the Lowspec spectroscope was the Orion nebula. The bright core of the nebula shows strong emission lines in Hydrogen, Oxygen and sulfur, which are often used for narrowband imaging. But there are also some lines of nitrogen and helium.
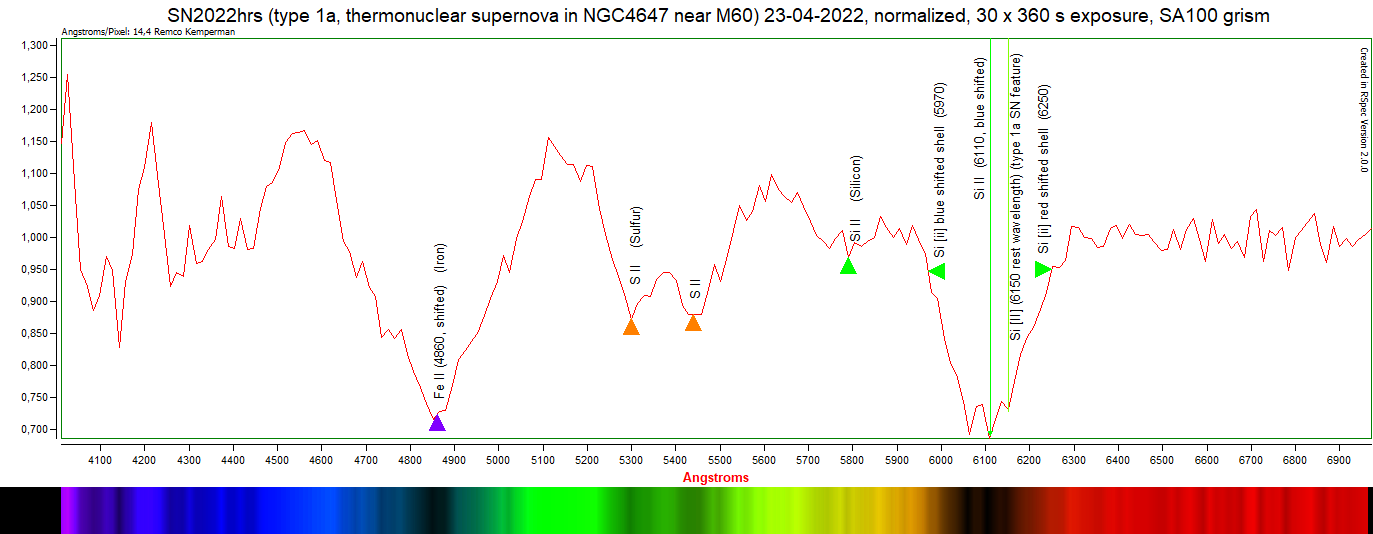
Supernova SN2022hrs near Messier 60
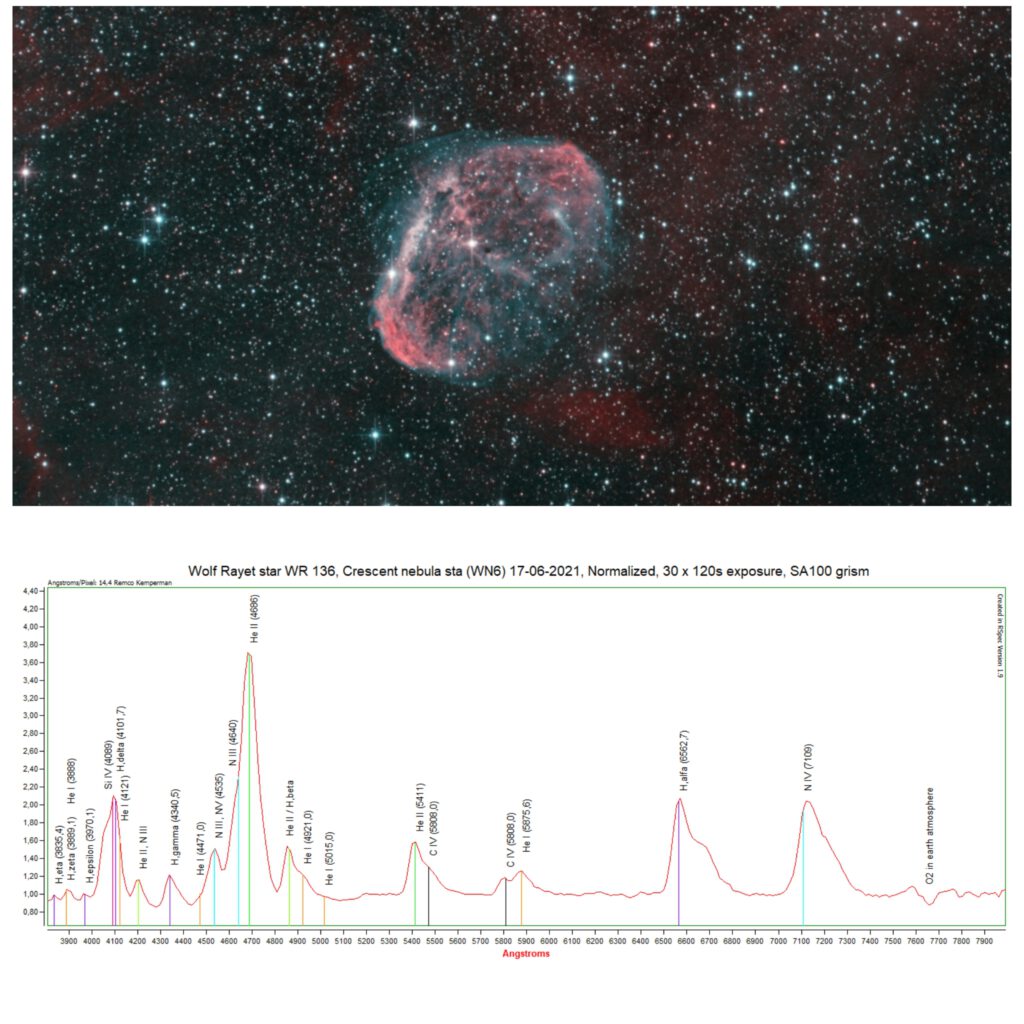
Wolf Rayet stars
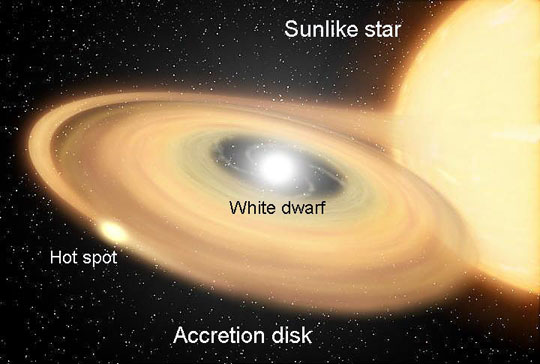
Stellar Novae
Stellar Novae occur when a white dwarf and red giant star are in a binary system. The gas from the inflated red giant is stripped of by the white dwarf and piles up upon it. When the pressure builds up to high, the material collected at the surfaces fuses at ones, causing a brightening of the star. This is where the term nova (new star) comes from.
If the build up of material goes more slowly en evenly it does not fuse, untill it reaches 1.4 solar masses. at 1,4 solar masses the white dwarf fuses the whole star at ones. This leads to a type 1a Supernova (such as SN2022hrs above).
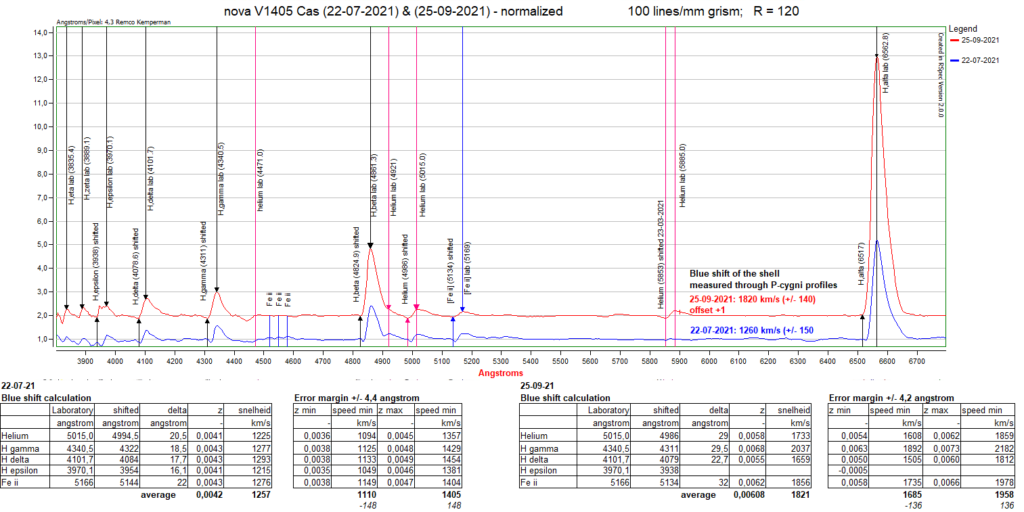
Nova V1405 Cassiopeia
Nova V1674 Herculis
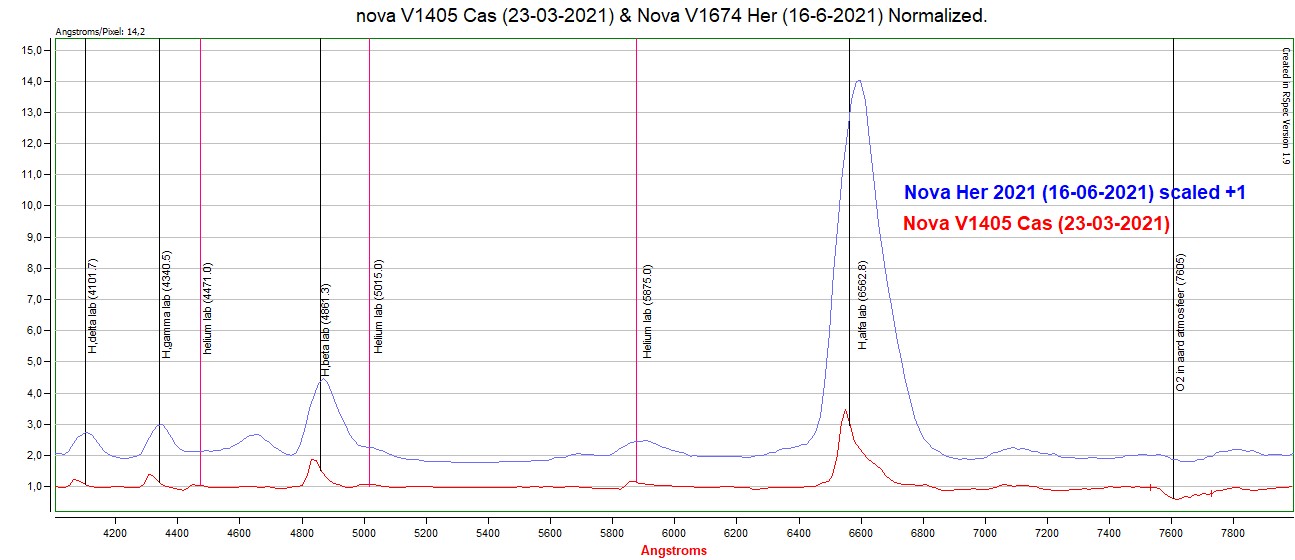
Nova V1674 Herculis was discovered in june of 2021. At the 16th of june I took a spectrum of it. I compared the spectrum with that of Nova Cassiopeia. In comparison it has a much broader emission lines. This is an indication of a faster moving gas shell. In addition Nova Herculis has emmision features around 4.650 Angstrom which are not seen in Nova Cassiopeia. These are featerus of Magnesium.