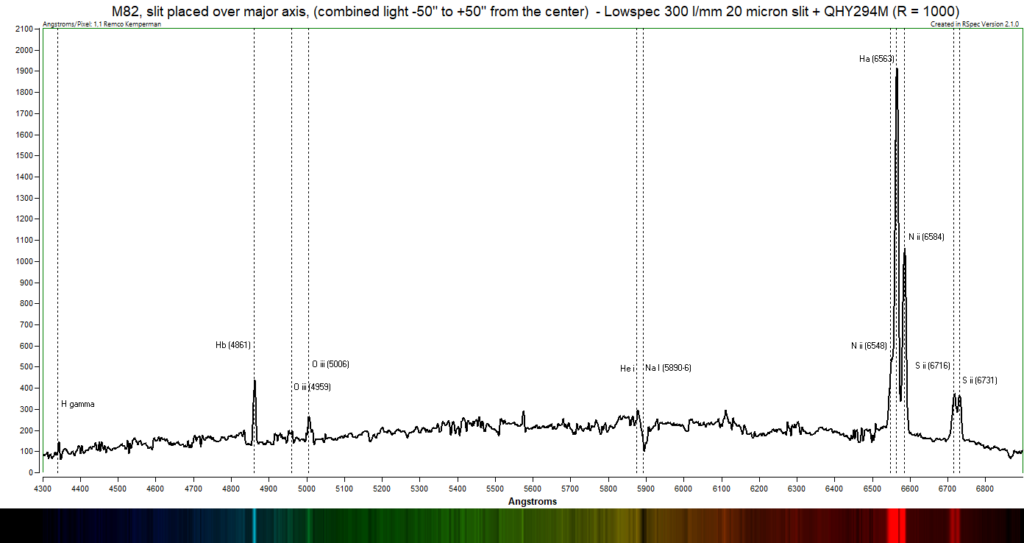
on the first of march 2023 I took a spectrum of Messier 82. This is a edge on galaxy. The goal was to measure the radial velocities and the rotation of the galaxy.
For that I placed the slit of my Lowspec 3.0 over the long axis of the galaxy. As the galaxy rotates, one side comes towards and the other side goes away.
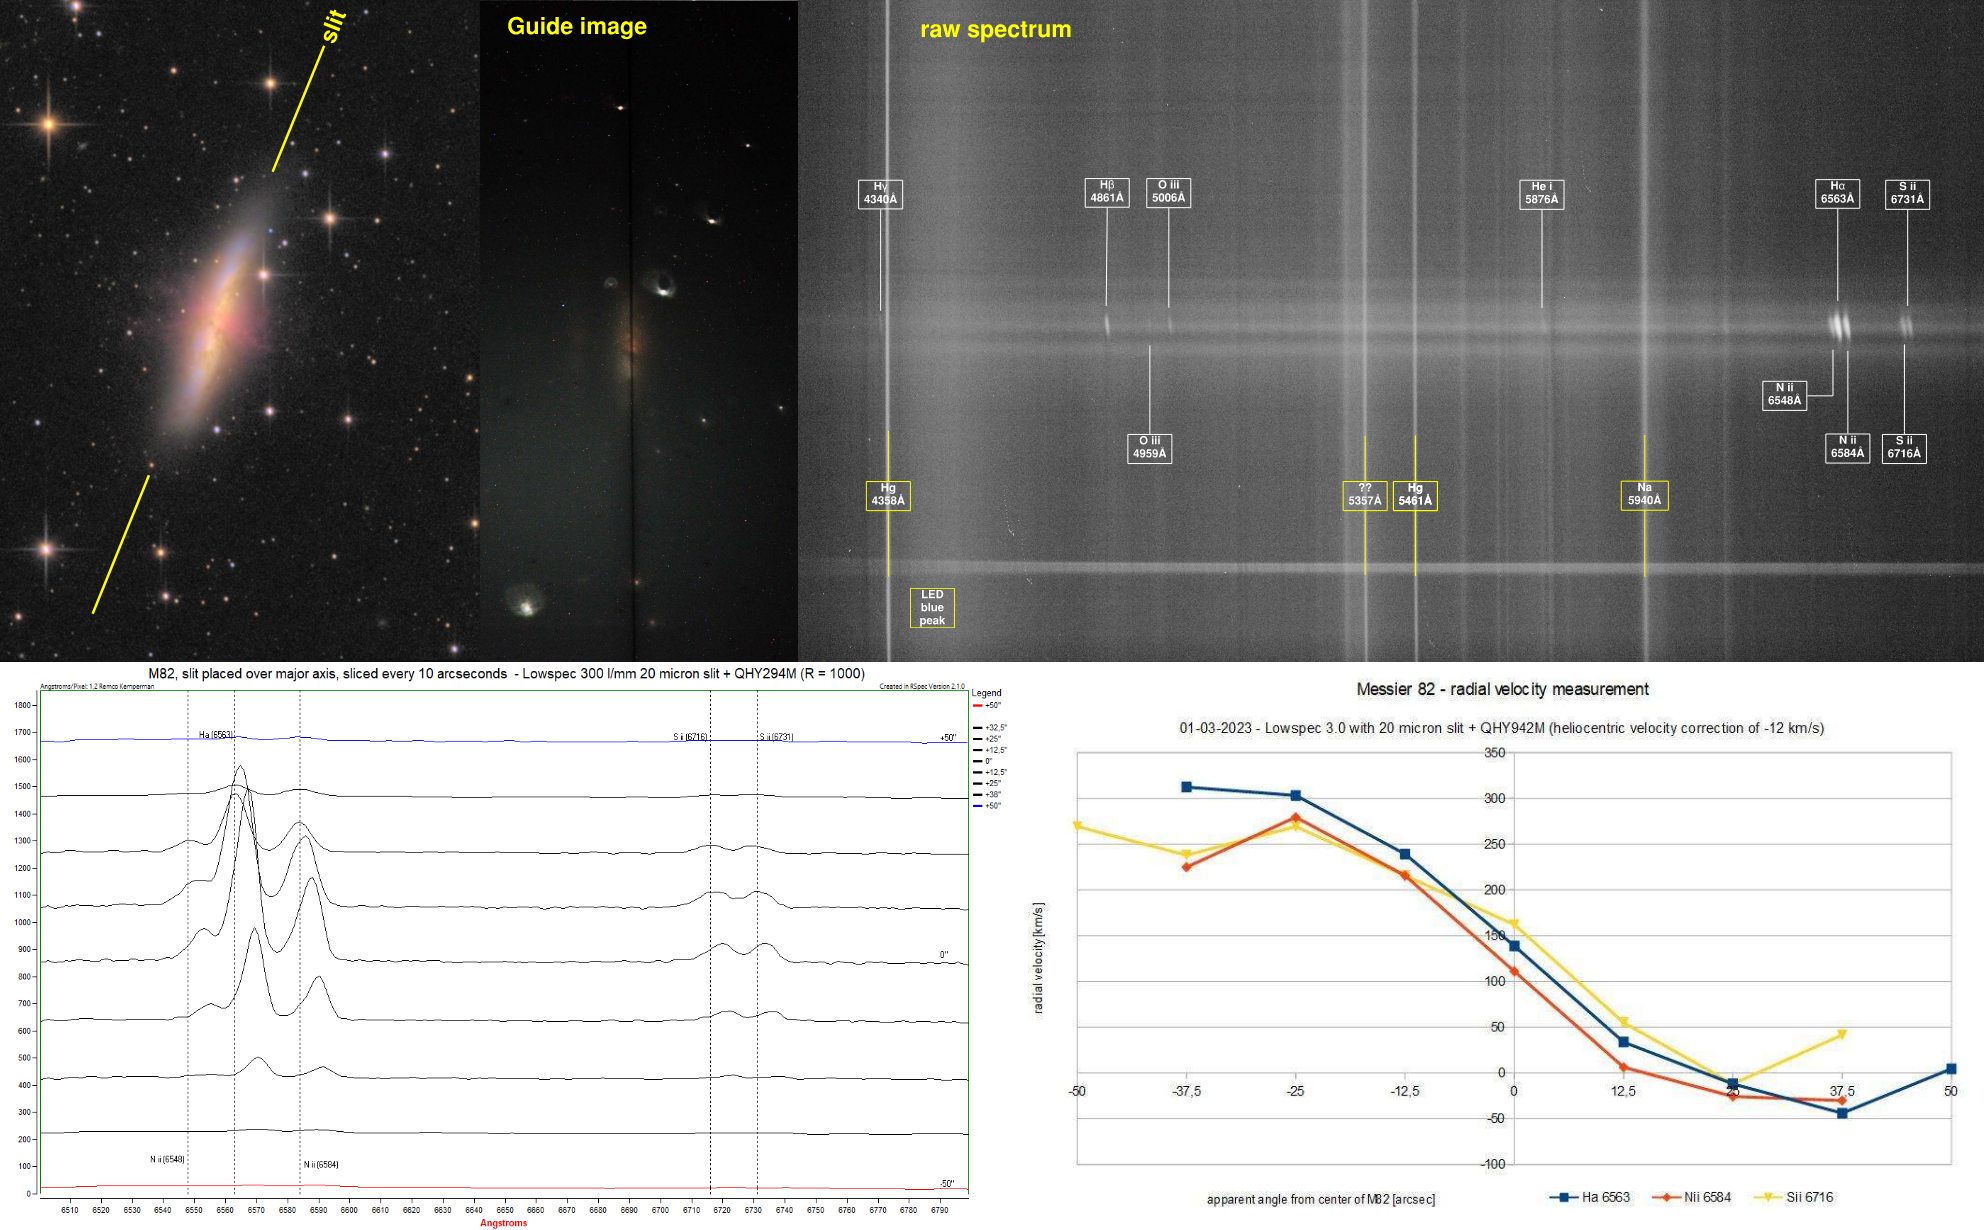
The guiding image shows a black line over the axis of M82. That is the slit. The missing light in that picture went into the spectroscope. In the raw spectrum you can already see the hydrogen, nitrogen and Sulfur emission lines being slightly slanted, which indicates some form of blue and red shift in the galaxy. One side is comming towards us and the other is going away, indicating rotation.
I have sliced up the raw spectrum in to 9 slices of 10 pixels each, corresponding with roughly 12,5 arcseconds per slice. The slices were processed individually. The presentation of the 9 sliced up spectra clearly shows red and blue shift. (Swipe to see those)
The peak wavelength of the emission lines in these 9 slices was measured and translated into a radial velocities. I then graphed those against the apparent position from the center in arcseconds, giving the distinct s-curve of radial velocities of a rotating Galaxy. Also a correction of -12 km/s was added to compensate for our speed around the sun, at the moment of the measurement.
Fun detail, I have used the 2 bright mercury light pollution lines to aid the accuracy of the wavelength calibration.