the period-luminosity relation of pulsating RR Lyrea star
I have tried to determine the distance to globular cluster M3 with the help of brightness measurements of pulsating RR Lyrea star. This cluster of stars is in the constellation Cannes Venetici (CVn)
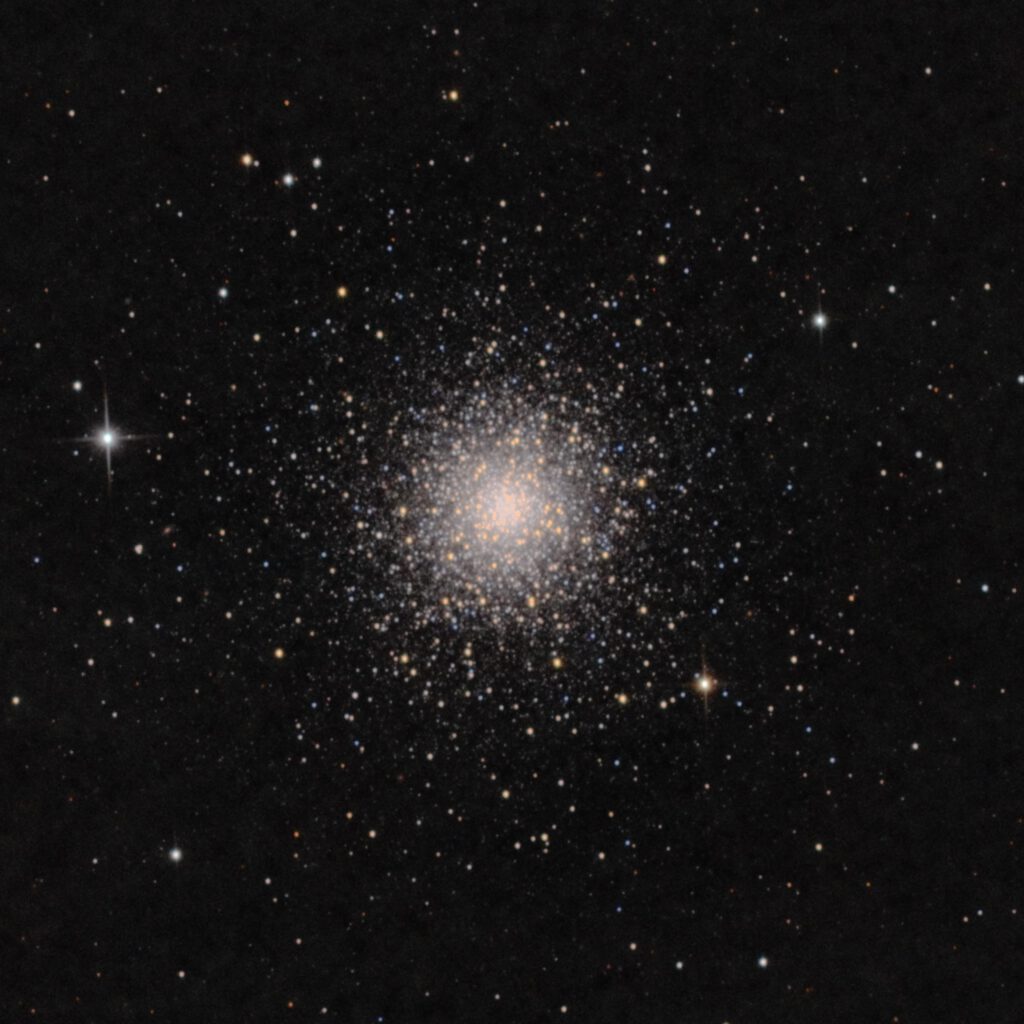
In March and April 2022 I have recorded this cluster for 4 nights. The goal for the first night was to see how many variable stars there could be seen in photometric measurements. Well that worked! There were 16 stars in my photometric analysis showing clear variability.
These turned out to be RR Lyrea pulsating stars, apart from one eclipsing binary. The pulsating stars have a period around 12 hours. Because at this time of year I can’t capture a full 12 hour cycle in one night, I decided to record the cluster another 3 nights. Only in luminance (UV/IR cut filter) to boost signal for better photometric measurements.
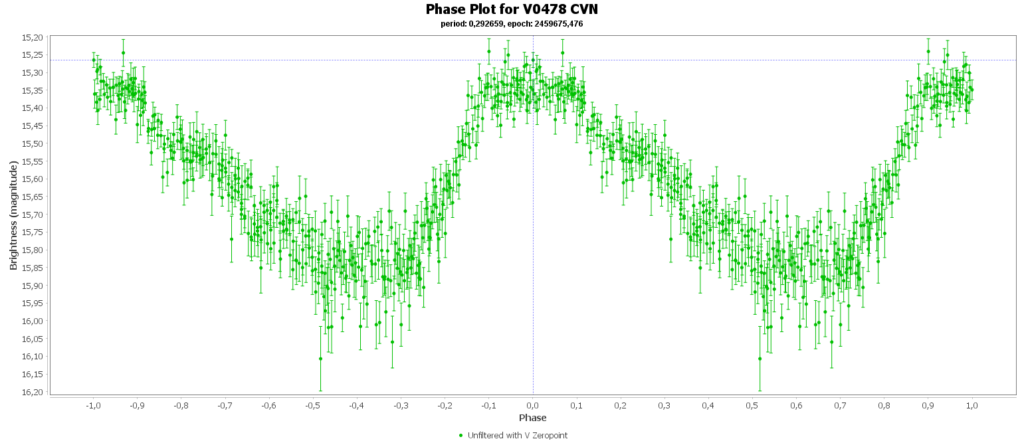
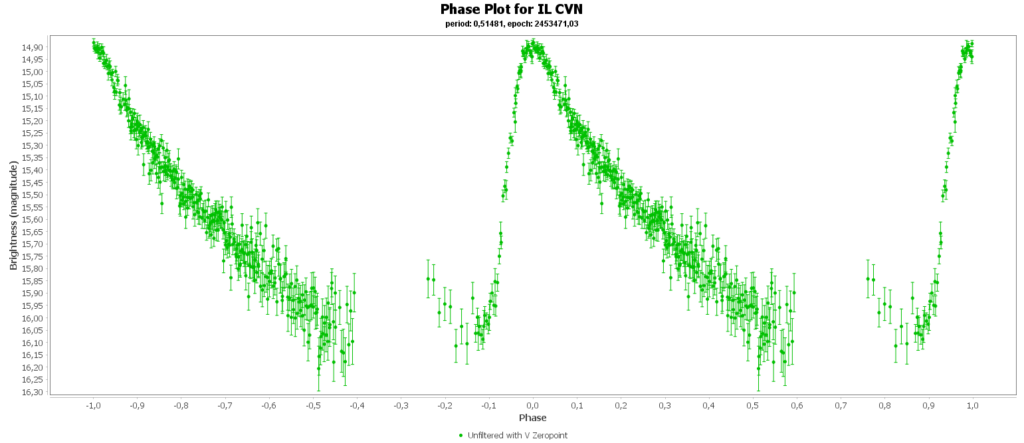
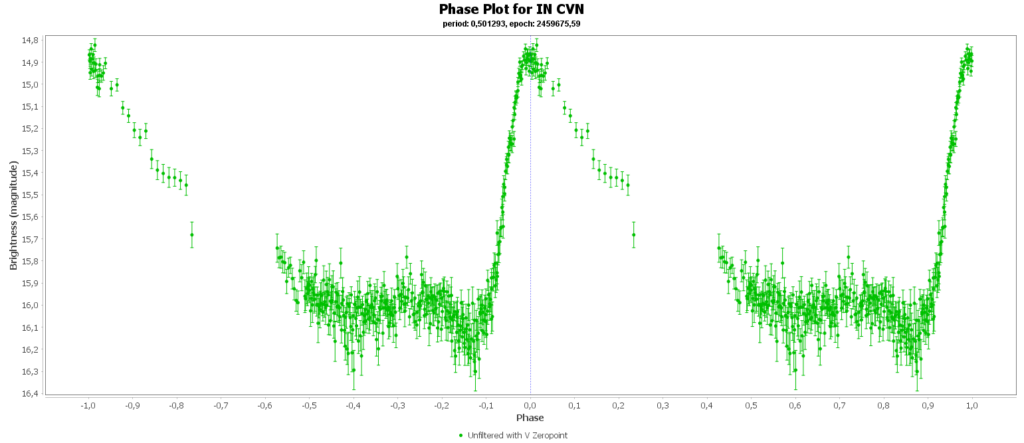
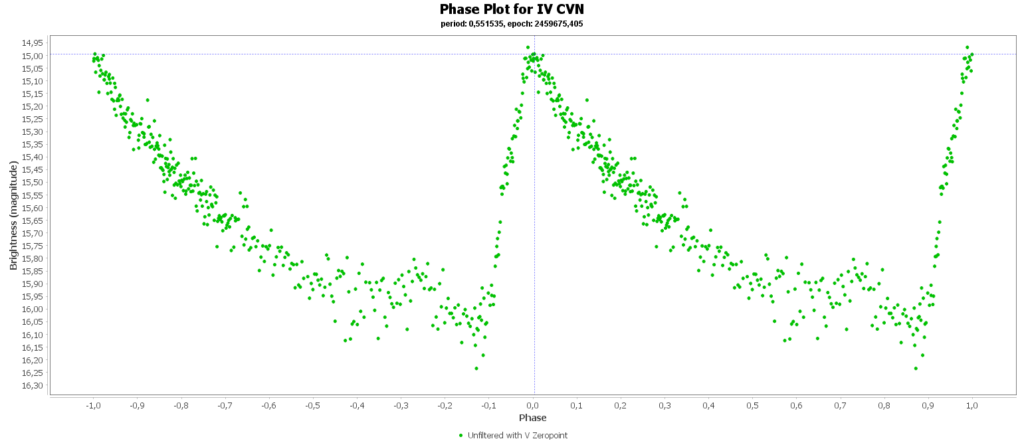
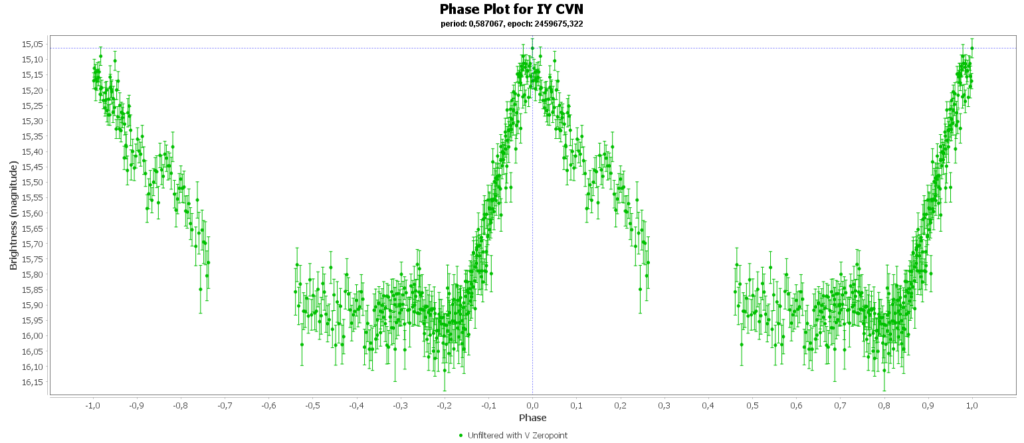
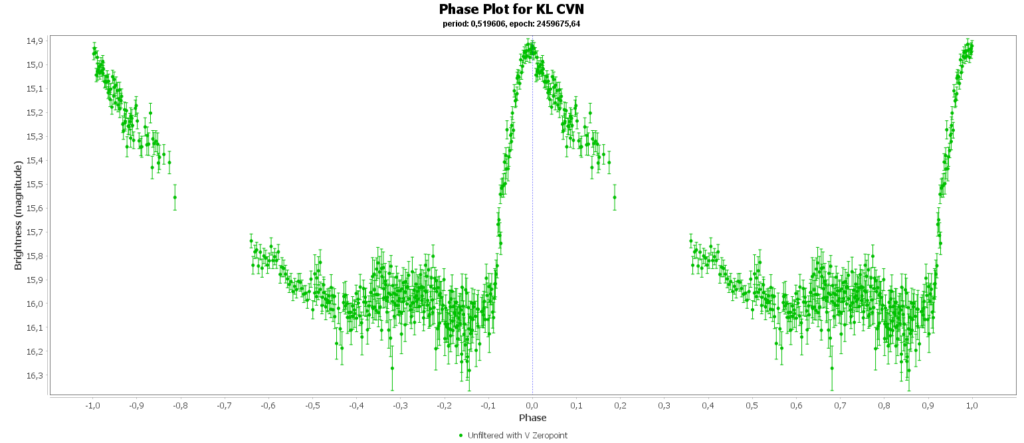
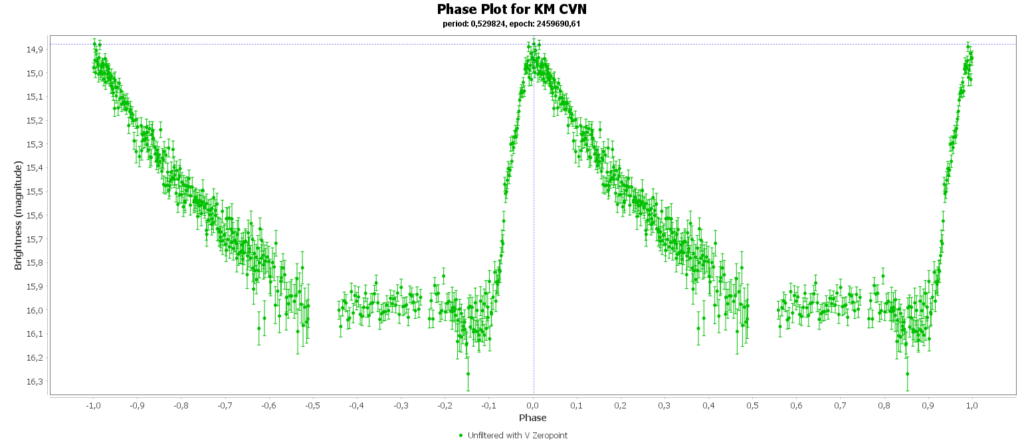
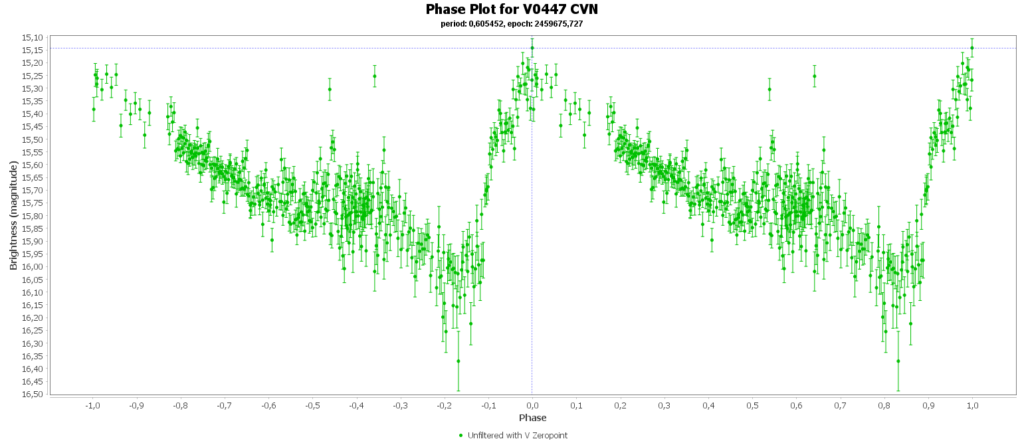
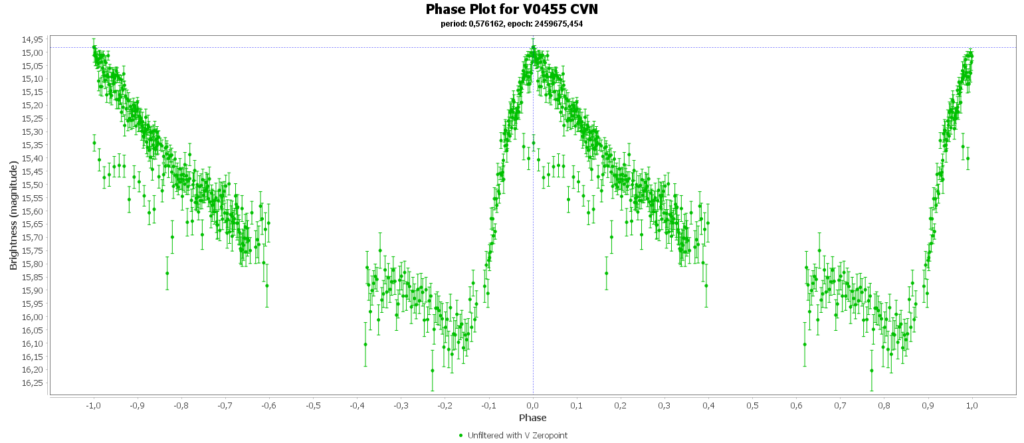
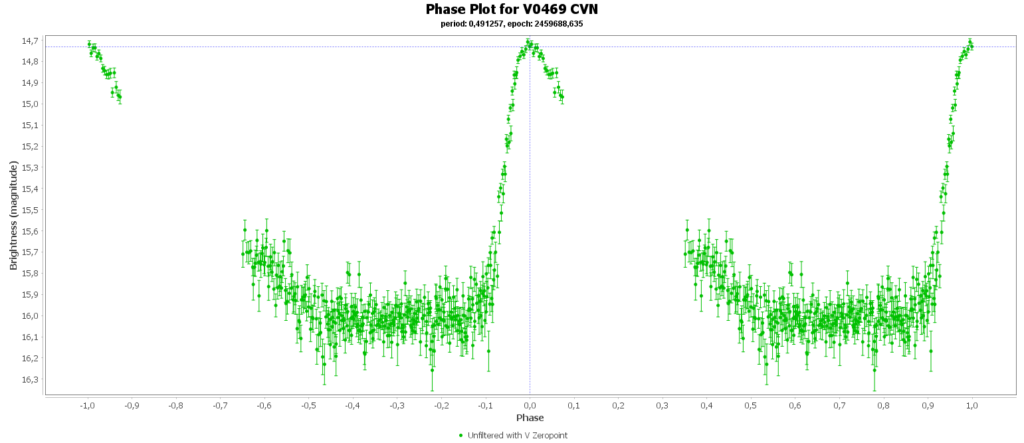
To combine the measurements from multiple nights in to one lightcurve I used the Vstar software from the AAVSO (American Association of Variable Star Observers). With that the period of a variable star can be determined, and with that period the different nights can be folded over eachother into a single phase plot. That looks like this:
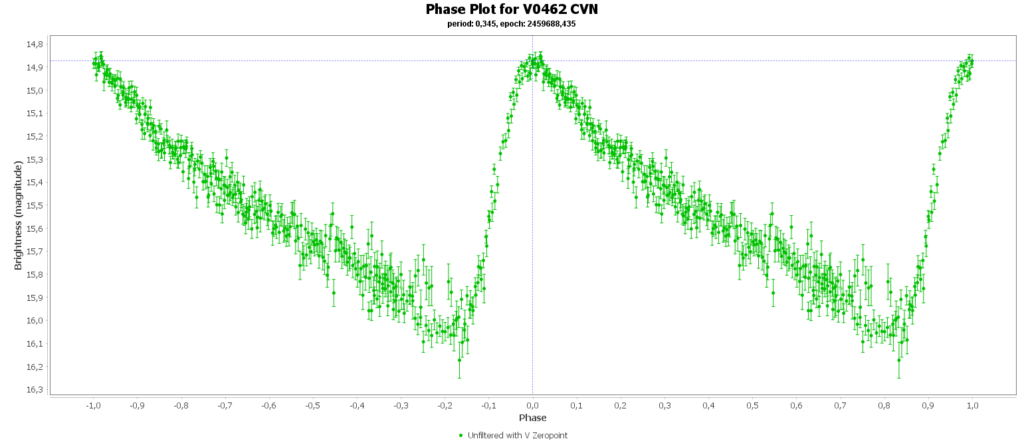
In some phase plots are still gaps after 4 nights. Those stars have periods very close to 12 hours. So in each night mostly the same part of the cycle is captured, leaving out some parts.

At the end of this page all 15 phase plots are gathered in a gallery.
Animation
as a bonus I could make a animation of the recordings of one night. For that I stacked 10 images of 3 minutes into a single frame for the animation. In total I had 130 three minute frames. So this results in 13 frames. The loop in the animation represents a time period of 6,5 hours. In the animation there are far more then 15 stars showing pulsation. This is because I could only do good photometry on the outer edges of the cluster. Towards the center, the stars are too closely packed together for that.
Long story short: it did not work. De period-luminosity relation of these kind of stars in de green (V) band is not well definined. But what I do no know is what I need for another try; A new infrared photometric (I) filter.
RR Lyrea pulsating stars
Al these pulsating stars in Messier 3 are RR Lyrea stars. This type of stars pulsates with a period of roughly 6 to 24 hours. Within the RR Lyrea there are 3 subclasses.
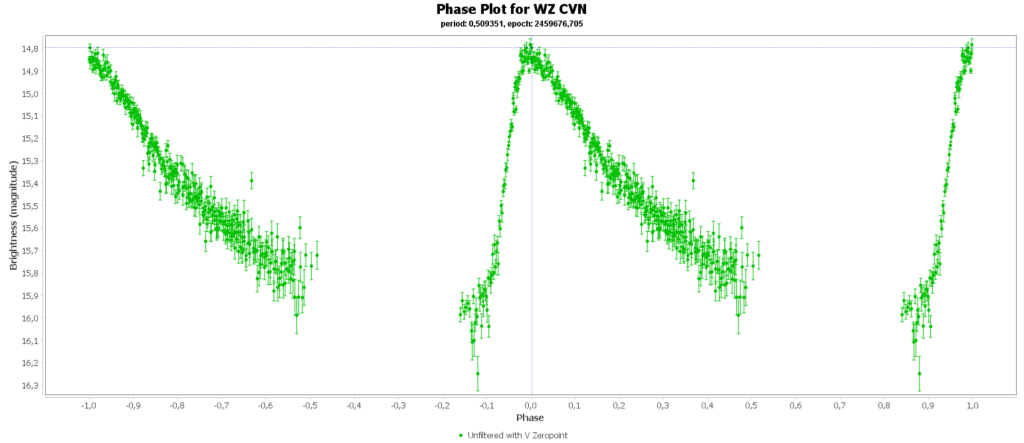
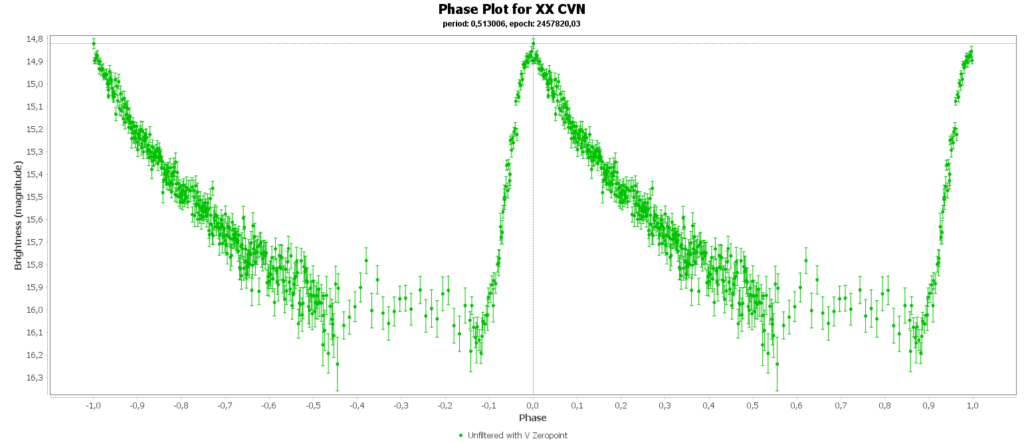
Most common (90% of total) is the RRab subclass. 12 of 15 in my measurements are this kind. RRab’s have a quick rise and a sawtooth shape in the lightcurve. As a bonus this subclass has the best period-luminosity relationship. Therefor the are the best chance to determine the distance to the cluster with that relation.
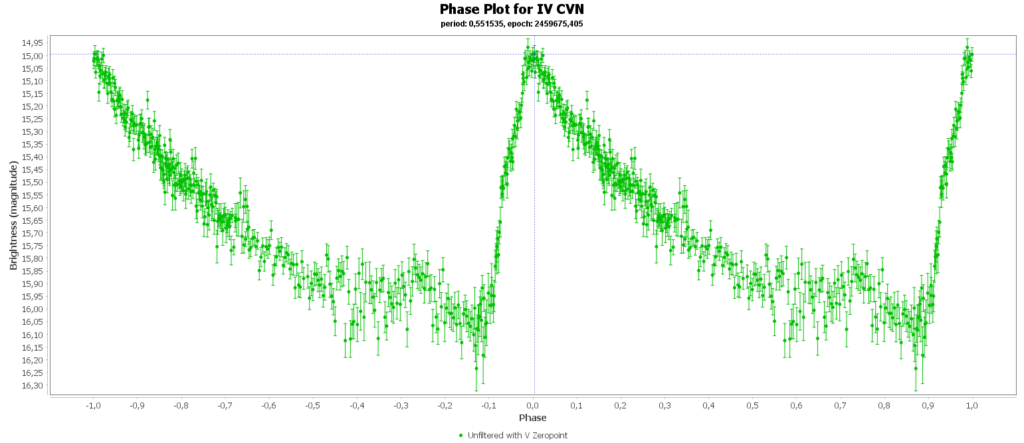
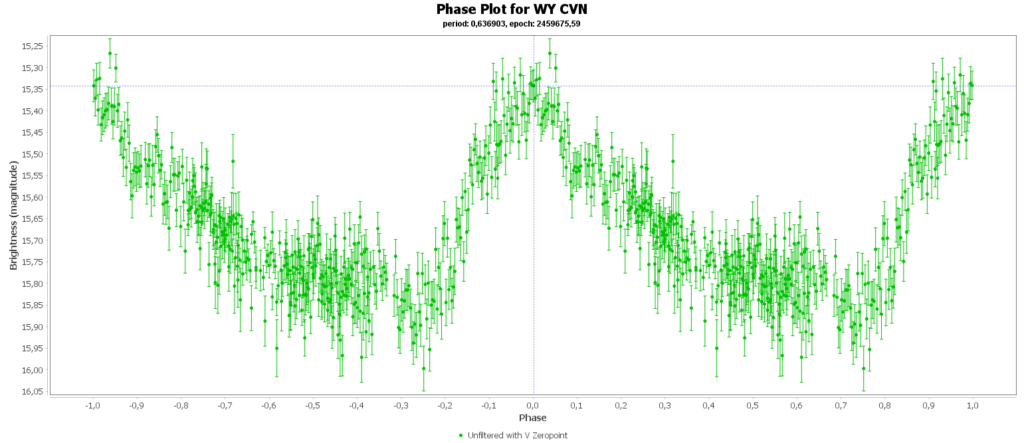
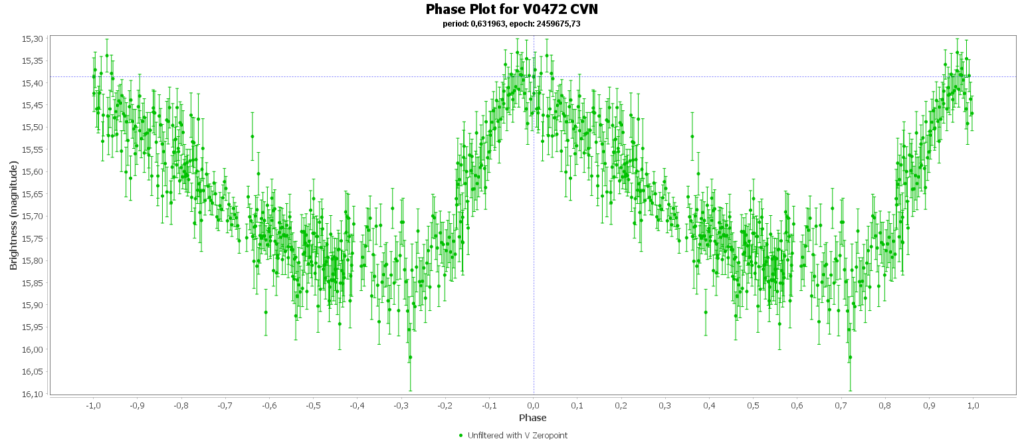
Then there is the RRc subclas (9% of total). In my case those are 2 of 15. These have a shorter period then RRab stars and there lightcurve is more like a sine wave, with less sharp peaks. This is caused by multiple modes of pulsation, causing amplitude and frequency modulation. Like this one:
Then there is the RRd subclass (1% of total). These were not among the 15 measured.
Period-luminosity relation of stars at the instability strip
RR Lyrea stars, like other pulsatings stars such as Cepheids, have a period-luminosity realtion. This means that if you know the period and the apparent magnitude, you can determine the distance to the star. For example, In the 1920’s Edwin Hubble used Cepheid variables to determine the distance to the Andromeda nebula and proofed that it was far outside our Milky Way, proofing the existence of other galaxies outside our own.
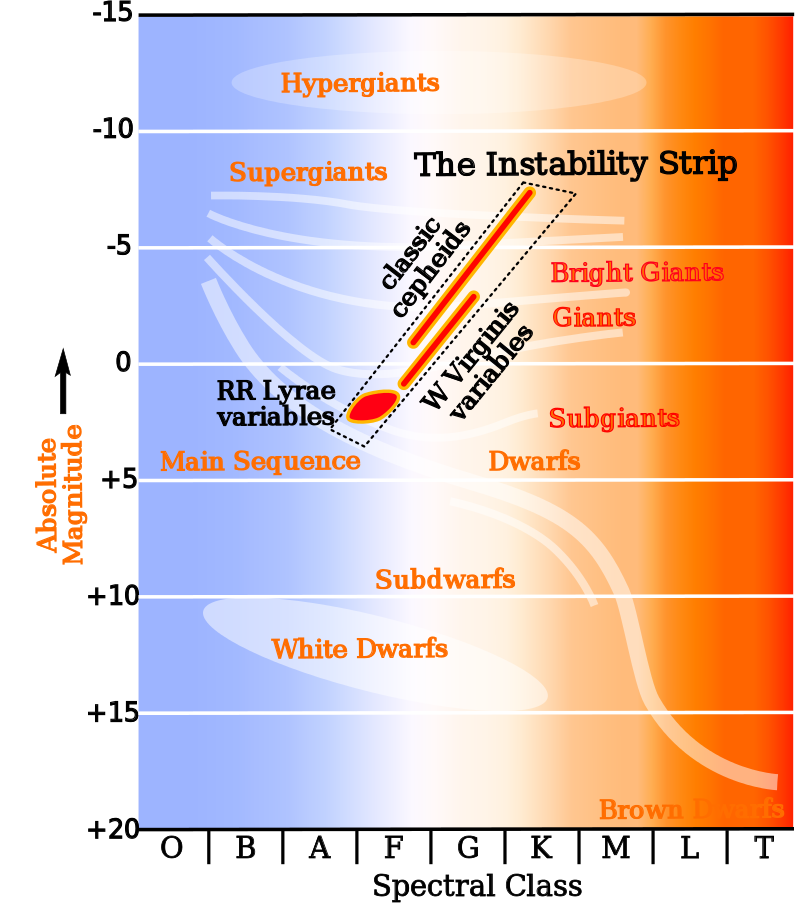
In the Hertzprung-Russel diagram multiple types of stars can be found with a period-luminosity relation. They are all on the instability strip.
These stars pulsate because exactly at the right the right depth in the star helium is ionized which makes that layer more opaque (Kappa mechanism). The lightpressure from the core pushes that layer outwards as a consequence.
The peaks in the phase plots correspond with the star being smallest in diameter. By compression of the gas it heats up which makes the star more luminous overall.
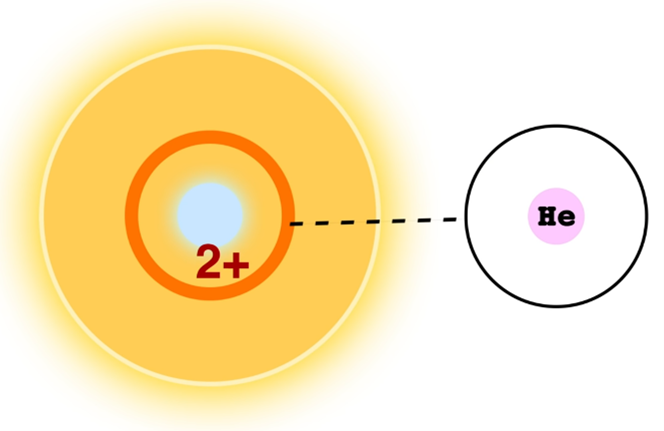
In the Kappa mechanism Helium switches from single ionized (He+) to double ionized (He2+) at a specific temperature in the star. He2+ is formed when the star is compressed by gravity and heats up. This makes the layer more opaque en the light pressure underneath expands the star. By expanding the gas cooles of and makes the star less luminous. He2+ recombines with one electron to He+ which makes it transparant again. The light pressure can escape through the layer and the star shrinks. This starts a new cycle of compression and ionisation, over and over again.
Attempt to determine the distance to Messier 3
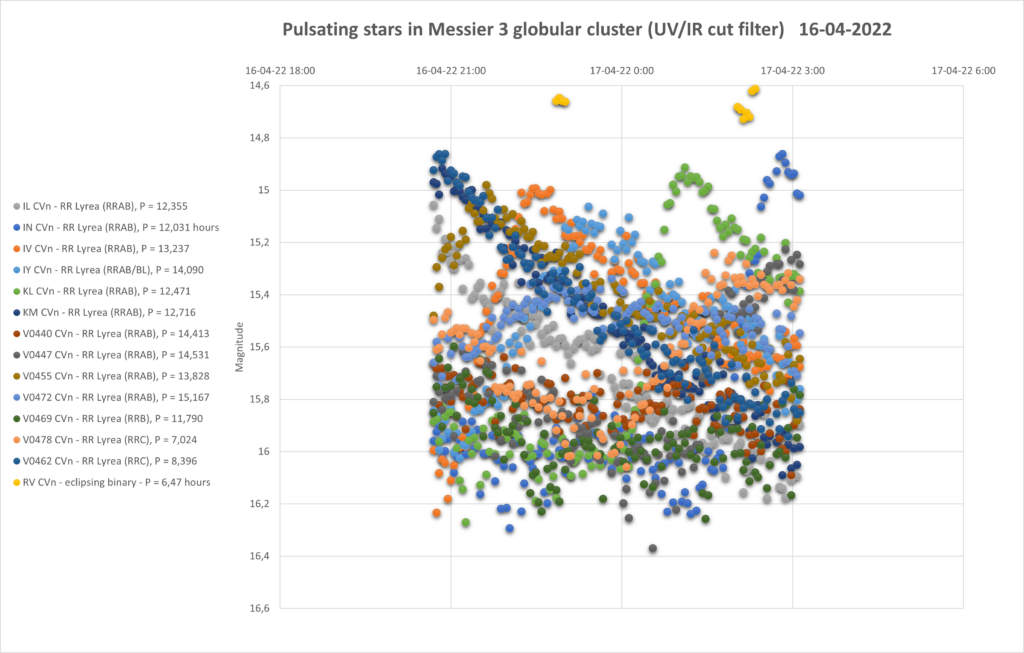
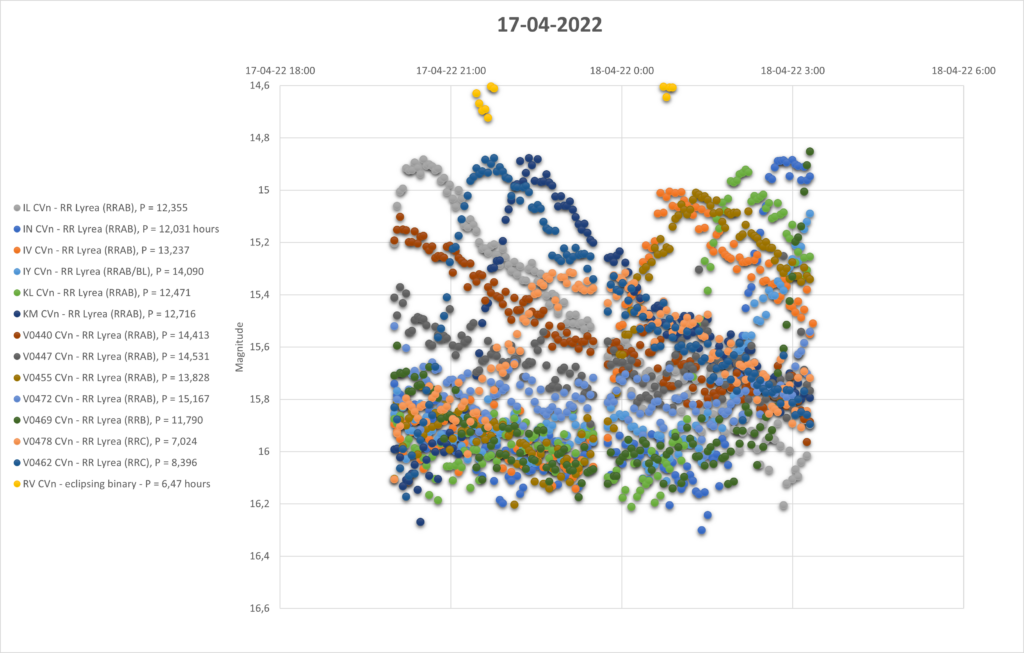
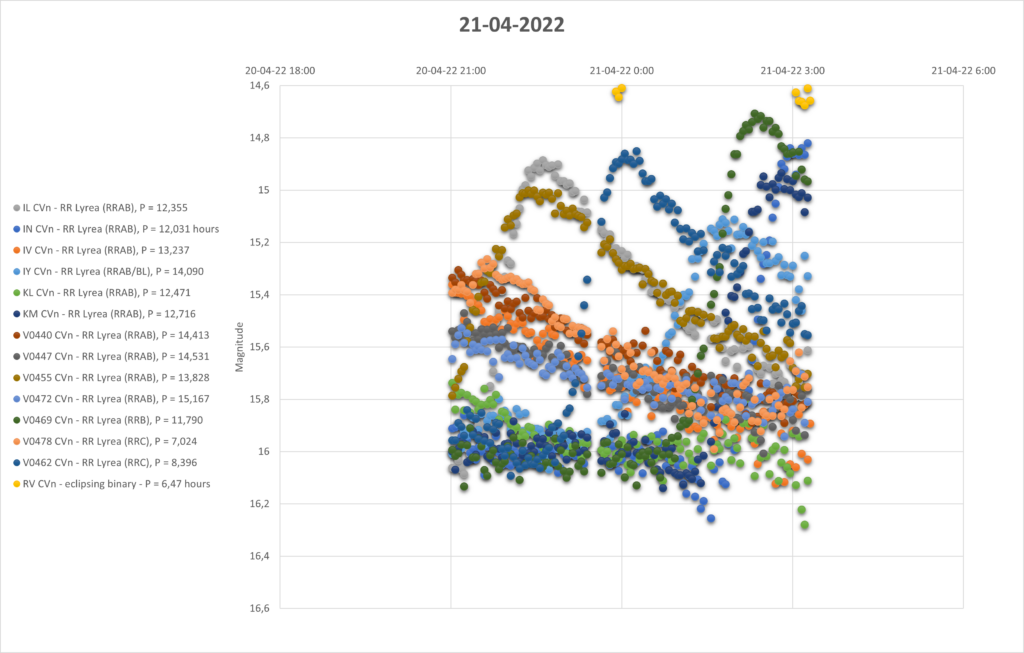
So I thought, I am going to determine the distance to the cluster with my measerements. For that I added 3 nights of measurements throuhg a luminunce filter. The following pictures are the lightcurves of those 3 days of all 16 pulsating stars.
You can see that they are all around the same brighness (pulsating between 15th and 16th magnitude). Alle the RRab stars in the collection have periods around 12 hours (11 to 15 hours). So that looks promising for a period-luminosity relation on first glance.
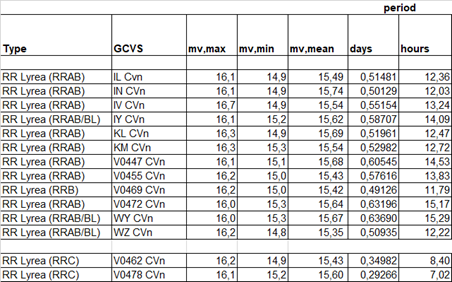
To determine the distance with the period-luminosity relation, the mean magnitude per star is needed. For that you can’t just take the average of all datapoints expressed in magnitude. That is because the magnitude scale is logarithmic, every magnitude means a factor of 2,51 in brighness. First you have to translate the magnitudes into a linear flux, then average all those datapoints, and finally the mean flux back to magnitude for the mean magnitude. In the table below I have done that for all 16 stars.
When I had this I thought, let’s have a go on plotting the aparant magnitude against the period to see if there is a relation. As all stars are in Messier 3 they are at the same distance and there shoud be a relation. A shorter period should come with a higher magnitude.
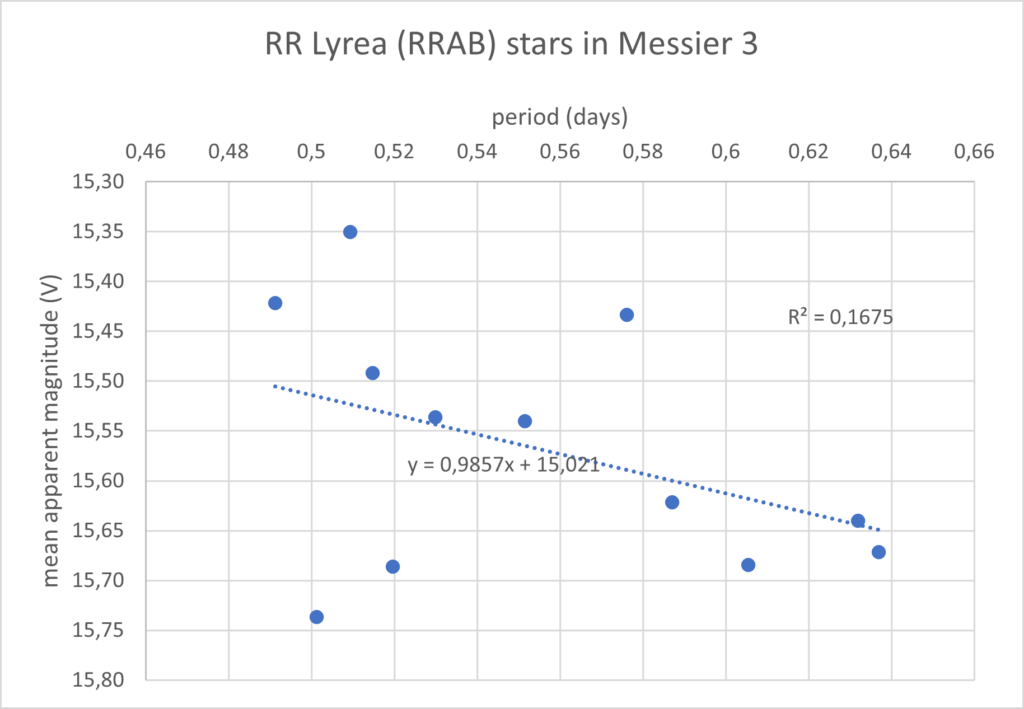
Much to my surprise, the relation runs the other way around! If there is a relation in the first place. The determination coefficient ‘R2‘ is very low (0,1675). This is the measure for how good a fit the datapoints have with the trendline of those datapoints. 1 being a perfect relation and 0 none at all. 0,1675 is not very good and can’t be called a relation in my opinion.
After that I went back to google and searched for some research papers about this. A number of papers report that the period-luminosity relation of RR Lyrea stars in the green (V-band) is very unstable. My measurements are taken in the V-band. I can’t find a single paper that states a relation in the V-band.
As an experiment I have tried determining the distance with the period-luminosity relation of the classical Cepheids in the V-band. This is Leavitt’s law, named after Henrietta Leavitt who came up with this relation in 1928. With this the absolute magnitude of a star can be determined from its pulsation period.

P = period in days
After that you can calculate the distance to the star with the following equation. With the measured apparent magnitude and the calculated absolute magnitude you can calculate the distance to the star.
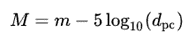
m = mean apparent magnitude
dpc = distance to the star in parsec. 1 parsec is 3,262 lightyear.
When I do this for the 12 RRab stars, I get to a distance of 66.000 light years. Dat is a factor 2 too far, as Messier 3 lies at appoximately 34.000 light years.
Better period-luminosity relation in infrared bands
What I can find in the research papers is the explanation why this does not work for RR Lyrea stars. De period-luminosity relation is there, but only in the infrared bands!
The further in the infrared, the better the relation is for these stars. The V-band is used in the research, but to determine the metallicity of the star. The metallicity has an influence on the pulsation period. Long story short, it was not as straight forward as I thought it would be.
The figure below is from one of the papers and nicely shows why I could not find a relation in my measurements in the V-band.
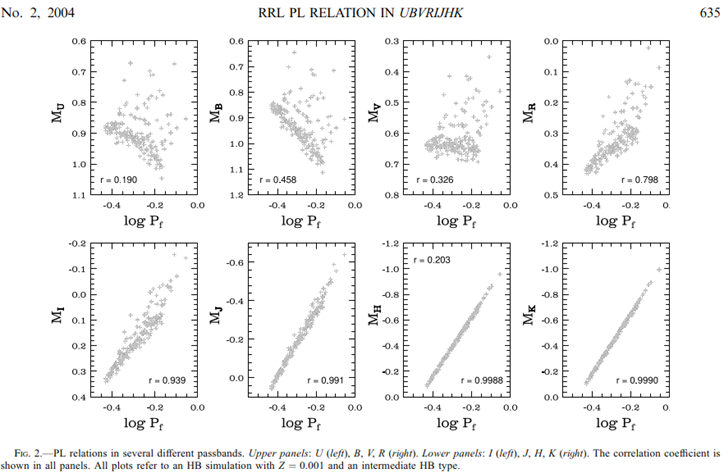
In the UV, blue en green band (U,B and V) the relation is very uncertain. In UV and blue it is even backwards. From red onwards the relation is better. The further into IR the better. The I-band is reasonably good with an R2 of 0,88 (r of 0,939 squared), so a strong relation.
These period-luminosity relations in the infrared bands are expressed in the paper as below. The I-band is feasible for me, because CMOS and CCD sensors can pick-up this band. There are also photometric I-band filters for consumers which and which are used frequently used by other amateurs. The onter IR bands (J, H and K) are further in the IR and fall out of the range of normal consumergrade sensors.
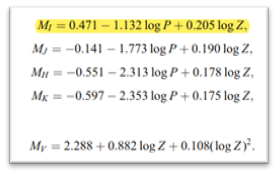
In this relation you can also see the term ‘Z’. This is the metallicity of a star. This is the fraction of the material that is not hydrogen or helium. In astronomy every element heavier than helium is called a ‘metal’.
For really old stars (population II stars) which are in globular cluster Z is typically maximum 0,002. Our sun is of a later generation (population I) and with a Z of 0,02 is much more metal rich. This is also the reason that in later generations of stars, such as our sun, rocky planets can form. This is not the case in low metallicity environments. So we do not expect rocky planets in globular clusters.
Conslusion
What do I have to do then? Get a photometric infrared (I-band) filter and repeat this whole excercise. That will be next year for Messier 3, but there are other globular cluster which also contain many RR Lyrea’s. A good excuse to get a new filter
To be continued 🙂
Sonification of RR Lyrea stars
Below you can see all the phase plot of the RR Lyrea stars. And below each of them a sonification of that phase plot, made at a sample rate of 44,1 kHz (so sped up 44.100 times) to bring it in the audible range. Each of them is then corrected for their own period to give them all their right period so that a pulsator with a shorter period will have a higher pitch, and vice versa.


Double bonus
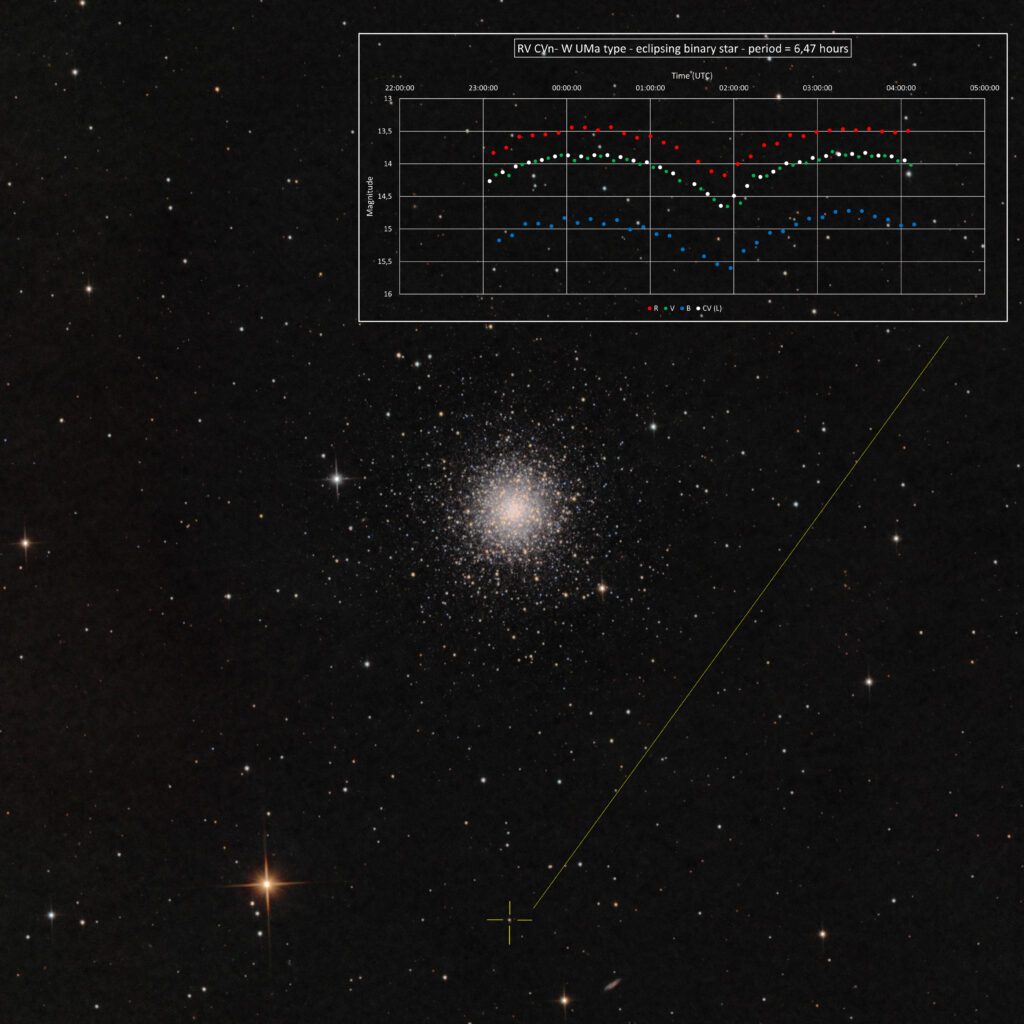
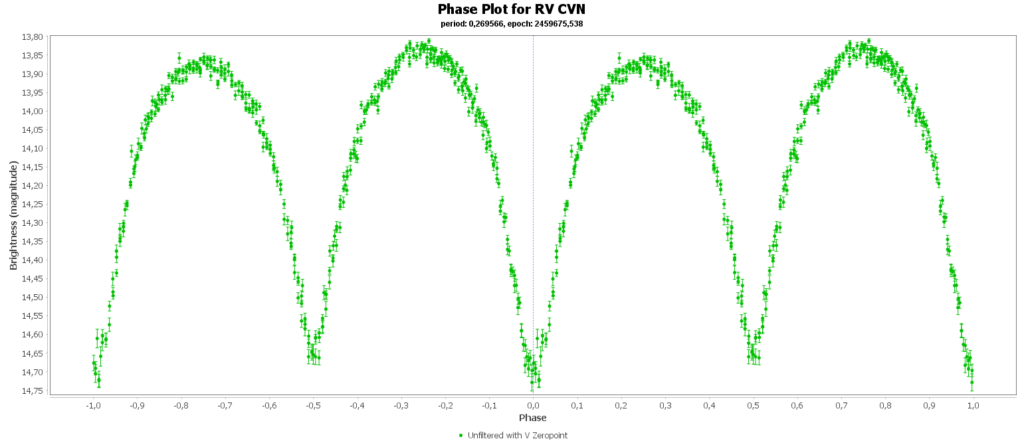
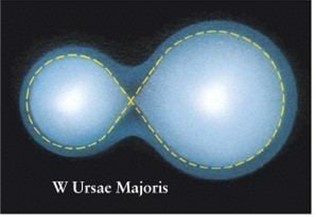
In the field of view of M3 there was also a eclipsing binary star RV CVn. These are 2 foreground stars that are not in M3. The orbit around each other in 6,47 hours. In that time we see 2 dips in brightness, caused by one star blocking the light of the other. Both stars are severely deformed by tidal forces, making them into a peanut shape. Some of these binaries (W UMa type) are also contact binaries, exchanging material from one star to the other.
The deformed shape makes that the light curve does not have flat tip with two dips, but is constantly changing. In the orbit the amount of surface area we see of the star is contantly changing, causing the brightness variation.