in the summer of 2023 I have taken a number of spectra of HD226868. This hot blue giant star (spectral type O9-ia) is in a binary system with black hole Cygnus X-1. These two bodies orbit eachother in 5,6 days.
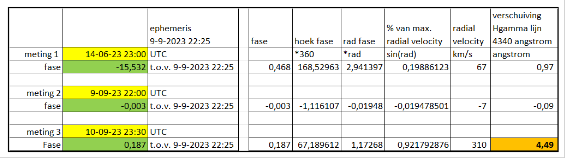
As I found in the literature about this first x-ray source that was found in Cygnus, the orbital speeds of HD 226868 should be high enough for my Lowspec 3.0 to be measured. In the table below I have gathered the information I found in the literature about this binary system and calculated the maximum doppler shift that we could see from our viewpoint on earth. At a maximum doppler shift (red or blue) of 5 Angstrom this is feasible for my setup. And if you lucky you should be able to see the system at both its maxima, at 10 Angstrom apart.

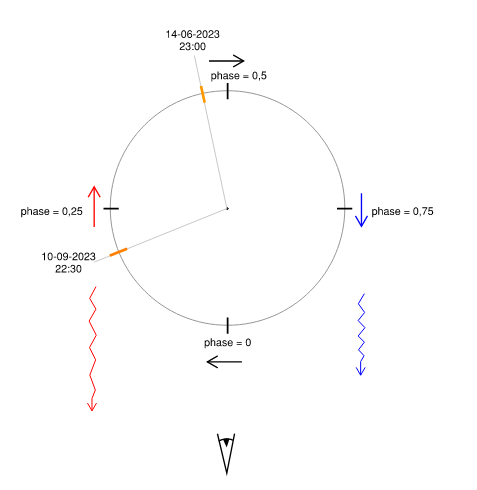
So at June 14th I took the first spectrum. This happened to be at almost its rest wavelength, so not ideal but a good benchmark for the next measurements. I got the timing of the system from the AAVSO which lists the ephemeres of the system, so the times of conjunction.
the second measurement I had at september 9th, but that was even closer to conjunction with even less doppler shift, so I did not analyze that further.
At September 10th it was clear again and this time it should be at almost its maximum red shift (~90%). in the table below I gathered the theoretical doppler shifts of these 3 dates based on the ephemeres data from the AAVSO
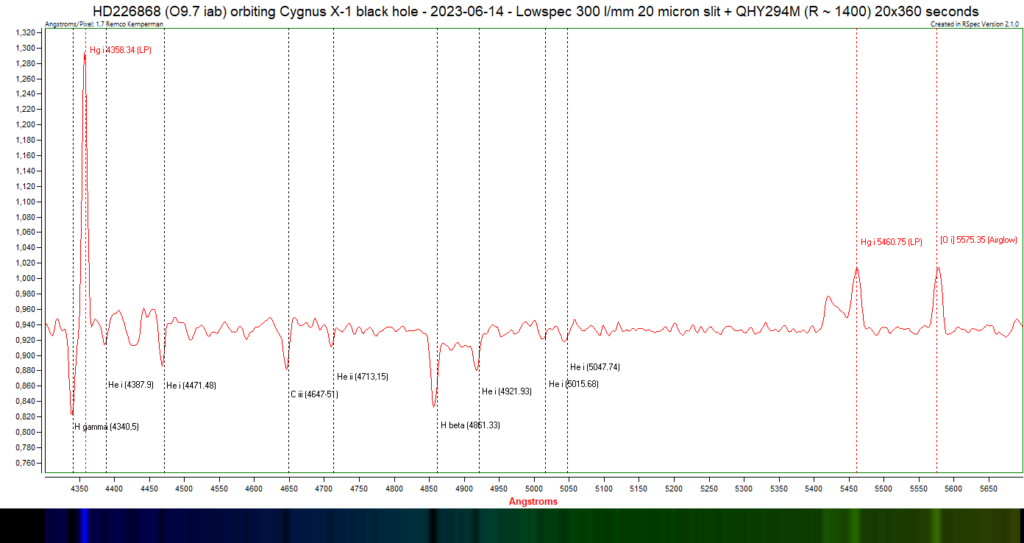
The graph below shows the 2 analyzed data points, from June 14th and September 10th. The emission peak is a light pollution peak from TL lamps. It is a mercury line that is always feasible in my long exposure spectra. There are also some further on in the red green part, from mercury and skyglow (O-i). I have used these 3 background lines to carefully calibrate the wavelength of the spectra and compare the absorption lines that come from HD226868. The H,gamma line and to He-i lines near that mercury peak are strong enough to get a reasonable measurement from so I chose those 3.

In this graph you can see that there is a doppler shift between the 2 data points of about 2 Angstrom. At this rest wavelength that corresponds to a difference in radial velocity of about 140 km/s.
In the spectrum below from June 14th you can see a larger part of the spectrum, with the 2 other background emission lines included which were used for calibration.
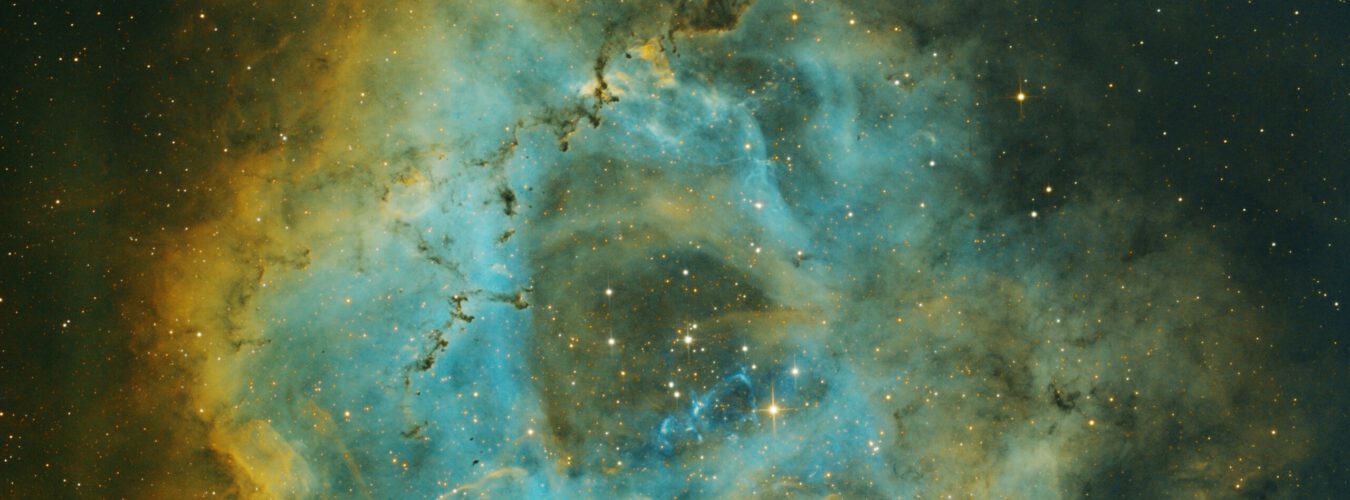
The SHO image of the tulip nebula which I took this summer also shows HD226868, to the right of the tulip nebula. The blueish shockwave which can be seen there comes from the jet from Cygnus X-1 black hole which colides with the surrounding gas. HD226868 is the brighter star at the center of that half arc.